3 Morpho-anatomy
3.1 Shoot traits
Shoot traits refer to all morpho-anatomical traits that can be measured on plant aerial part. Most of these traits are measured on the leaves but see Stem section.
3.1.1 Mass associated traits
Plant growth strategies and overall performances are often assessed via mass associated traits. Three masses are used to calculate different metrics. The Fresh Mass (FM) which is the weight of freshly sampled leaves. The Turgid Mass (TM) which is the mass of fully hydrated leaves. Leaf hydratation protocols are source of debate in EcoFog but are presented [here][Leaf hydratation] And the Dry Mass (DM) which is the mass of dryed leaves.
To be compared, these weights must come from the same sample and we must measure the leaf projected surfaces. See here for the leaf surface measurements protocols.
From these masses and surfaces are calculated metrics such as SLA/LMA, RWC, LDMC, WHC (Calculation).
3.1.1.1 Leaf surface
Most of leaf surfaces are obtained from leaf scans using office scanner. The used scanners are EPSON’s V800. To acquire leaf scans please see Image Acquisition. Depending on your research question you can either scan one leaf or several leaves (to have total leaf surface of your plant for instance).
Once you have one scan per experimental unit you need to extract its surface.
Surface measurements are made with the ImageJ freeware.
ImageJ works on all OS and can be downloaded [here][https://imagej.nih.gov/ij/download.html]
Surface can be measured manually or automatically
Manual measurements :
Launch imageJ -> File -> Open (Ctrl + O) and browse for the picture you want to analyse.
Then select the polygon selection tool 3.1.
Figure 3.1: Polygon selection tool in ImageJ
Zoom (-/+ or Ctrl+wheel in/out) into your image to see only the leaf you want to measure 3.2.
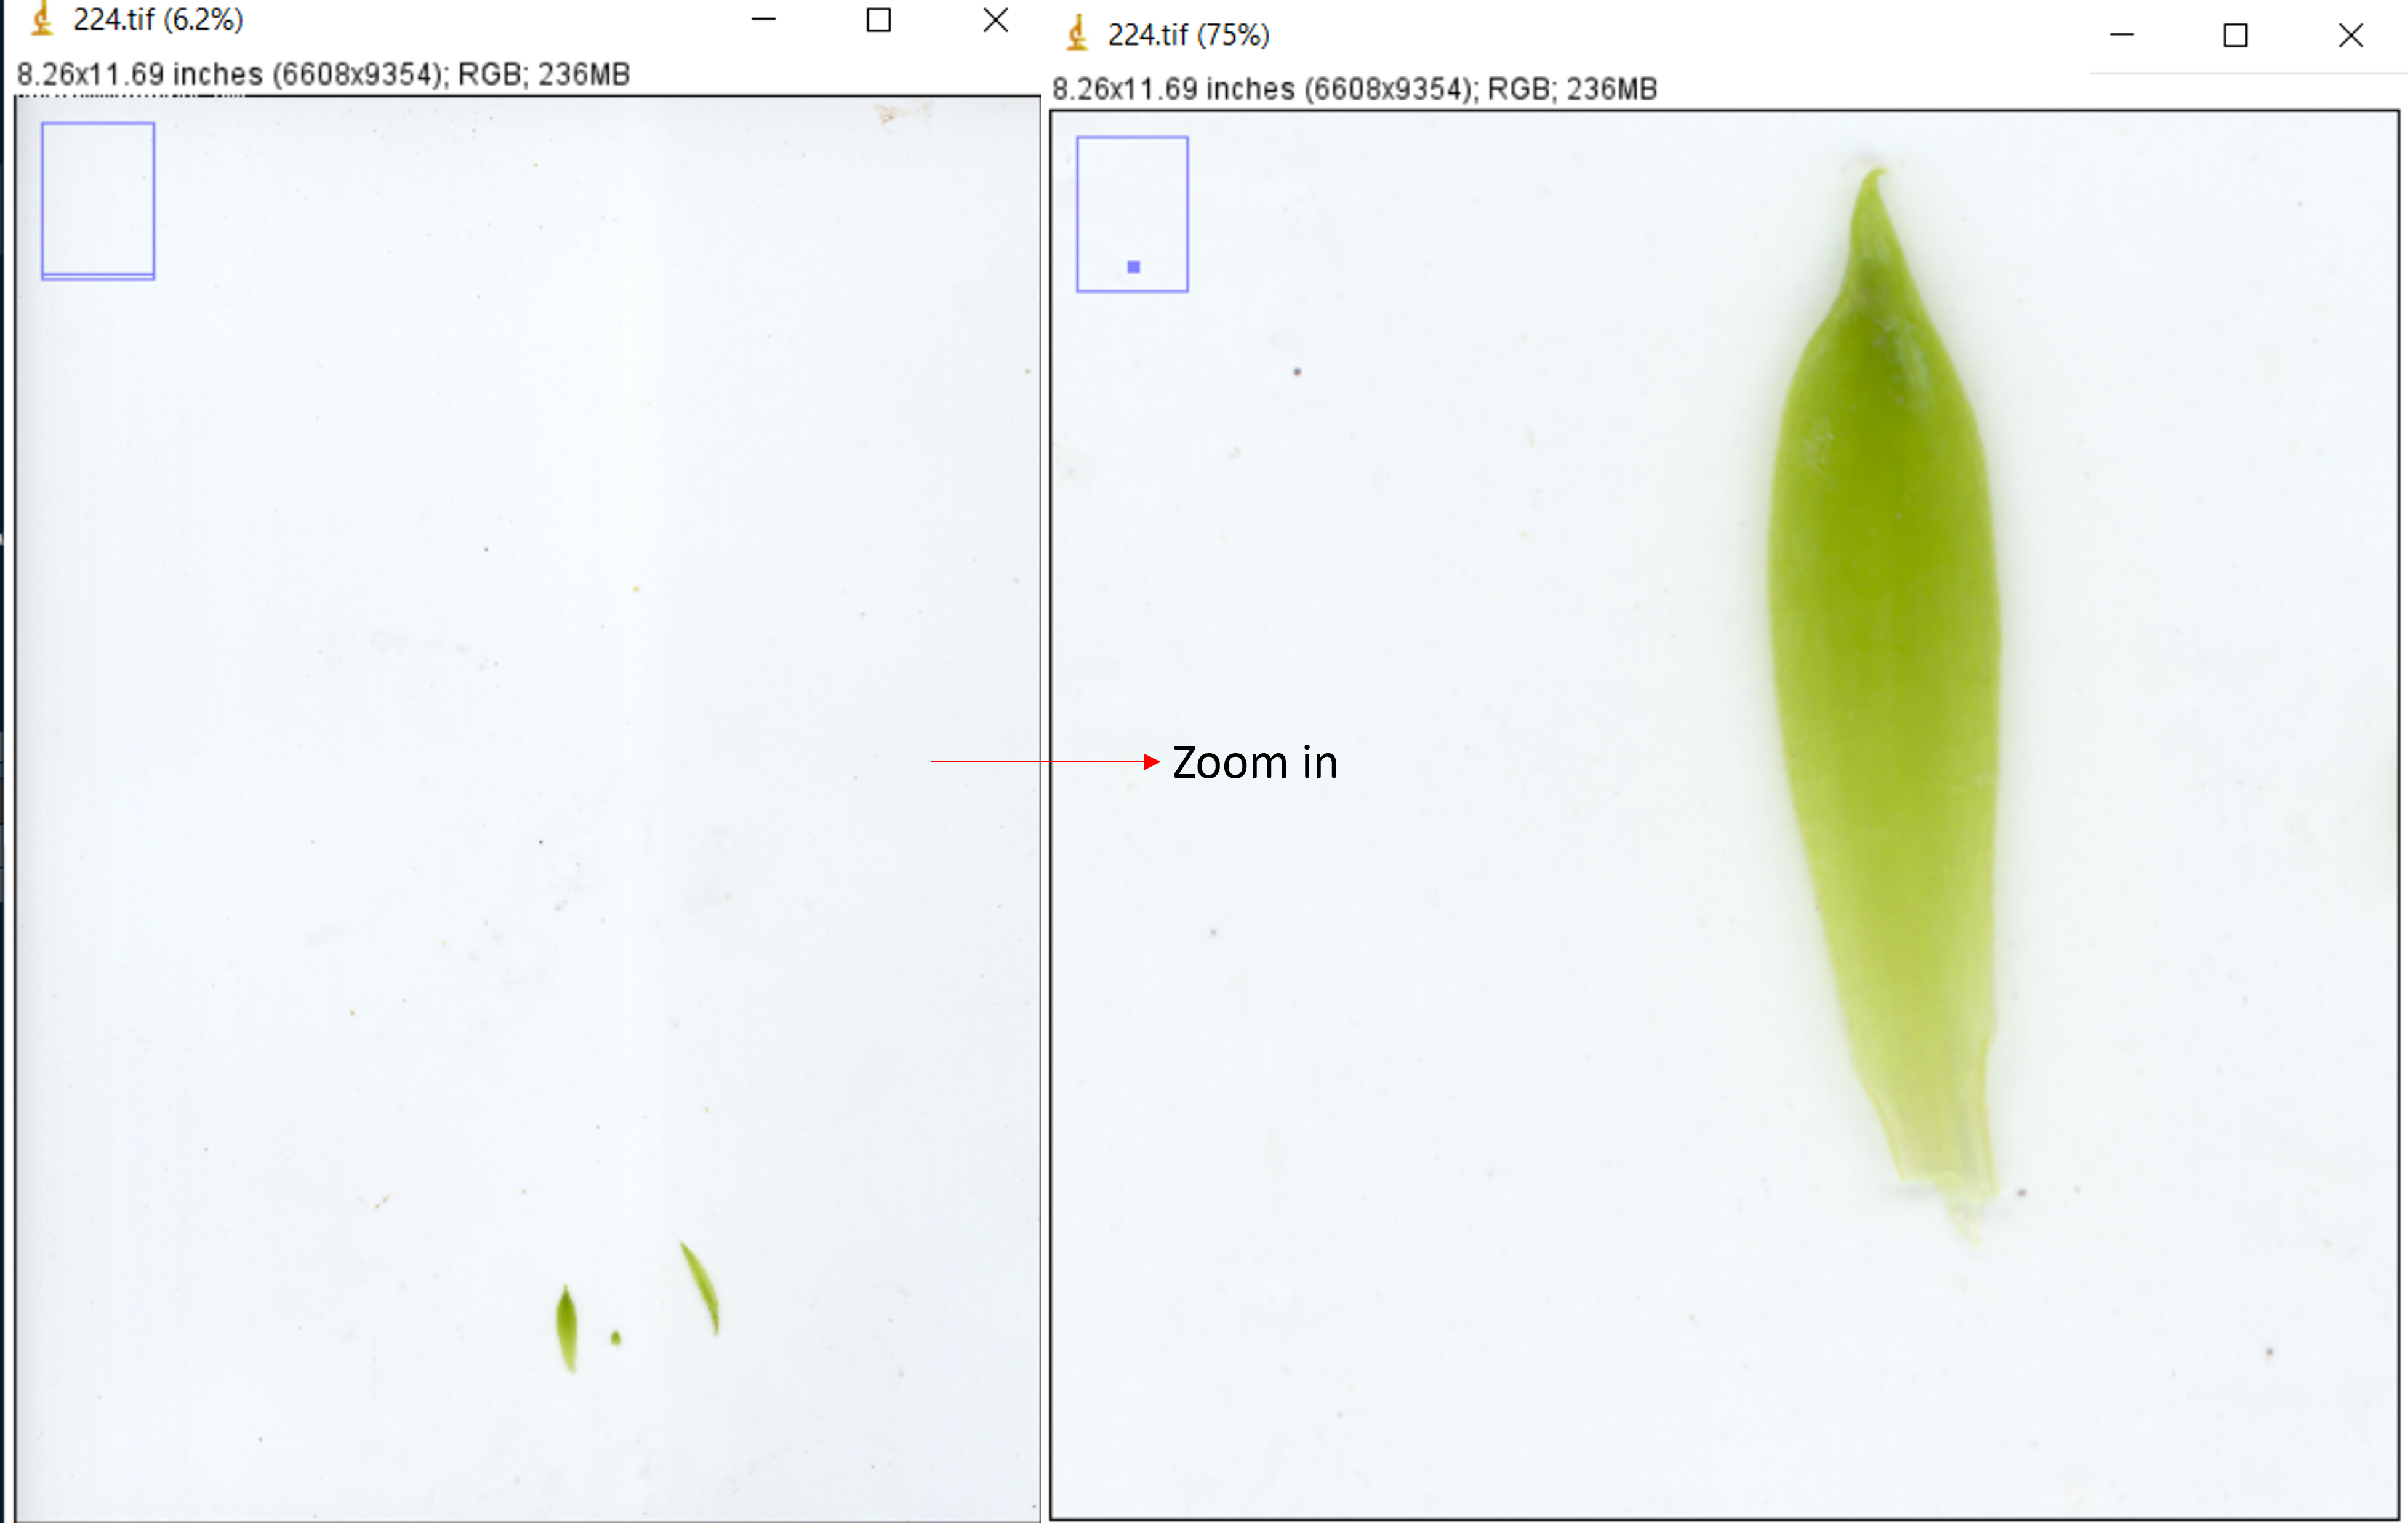
Figure 3.2: Zooming in ImageJ
Then you can left click to detour your leaf 3.3.
The more points you have the more precise and close to the leaf your measruments will be.
However, bear in mind that this is laborious and that as your zoomed in your error should be negligeable.
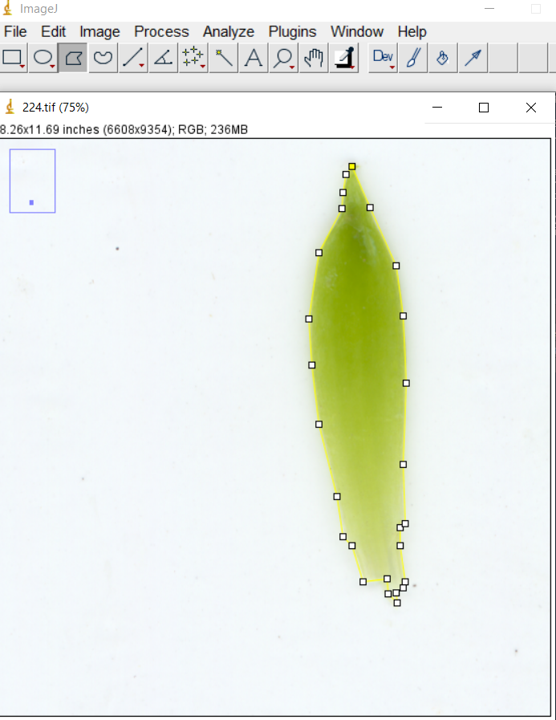
Figure 3.3: Leaf detouring in ImageJ
Once you’ve closed your polygon, press ctrl+M.
A window containing the results will pop-up 3.4.
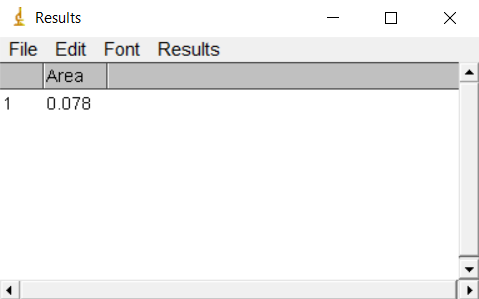
Figure 3.4: Results window in ImageJ
The Area will be expressed in the units of your photo. Some pictures have embedded scales in cm or inches but the default is usually in pixels (px). For more information see [ImageJ scale].
Each measurements will be added to the results window (one each time you press ctrl+M).
You can then save this window in the .csvformat clicking on File, Save As and browse for chosen location.
You can either have one file per photo (i.e. sample) and then name your file as your sample ID.
Or you can decide to have one file for all your samples.
Then you have to remember or write somewhere which measurements ID is associated to each of your samples to find who’s who 3.5.
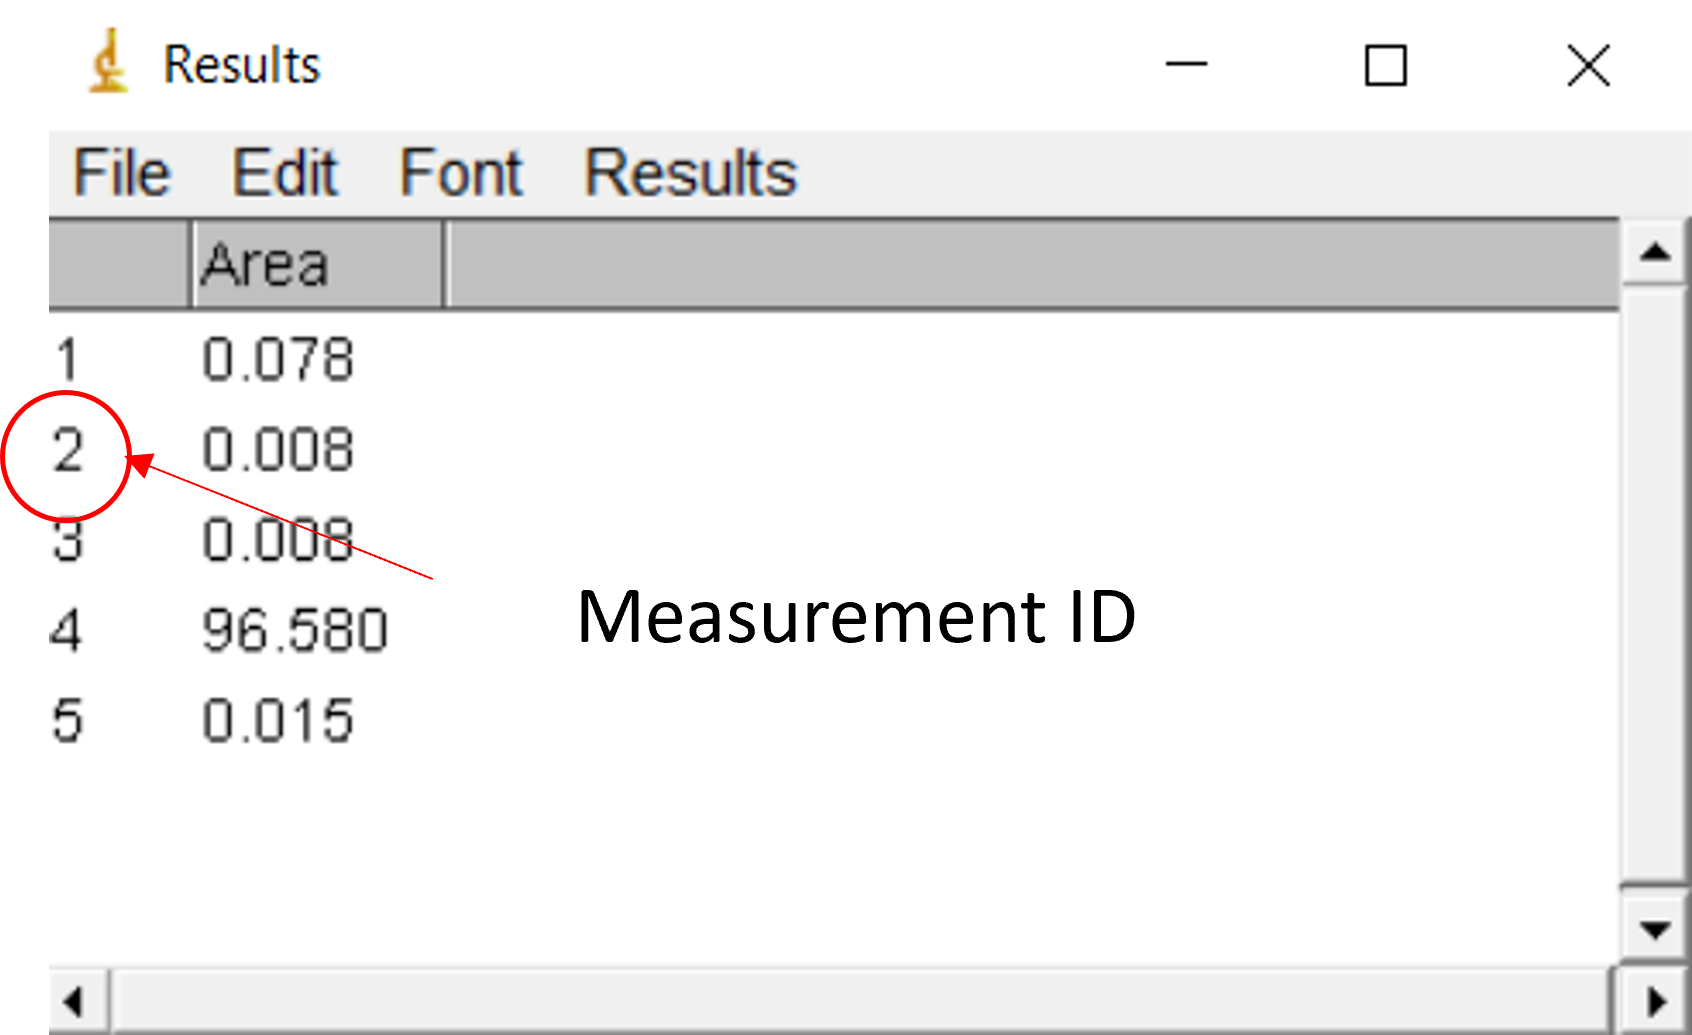
Figure 3.5: Measurement ID in ImageJ
Automatic measurements:
This will allow you to analyze many data at the same time. To do so you will need to use an homemade ImageJ macro.
Macro exemple. This macro is used to convert your colored scans in 8 bit black and white pictures. Then it set scale for 800 ppi scans (distances=800px known = 2.54 cm , pixel = 1). With ppi -> pixel per inch and 1 inch = 2.54cm. The pixel ratio is 1 as vertical and horizontal resolution is the same. It sets the contrast and then anaylze size of particle bigger than 0.01 cm^2 and smaller than infinity. It displays the results in summarize form for each pictures in the folder.
See here for a tutorial on macro recording in imageJ.
To launch a batch process go to Process-> Batch-> Macro....
This will open a window.
Fill the fields as follow:
+ Input: folder containing your pictures to be annalyzed
+ Output: folder to receive your output.
+ Output format: quite clear!
3.1.1.2 Calculation
| Acronym | Full name | Formula |
|---|---|---|
| LA | Leaf area | |
| FM | Fresh mass | |
| TM | Turgid mass | |
| DM | Dry mass | |
| LMA | Leaf mass area | \(DM/LA\) |
| SLA | Specific leaf area | \(LA/DM\) |
| LDMC | Leaf dry mass content | \(DM/FM\) |
| LS | Leaf succulence | \((FM-DM)/LA\) |
| RWC | Relative water content | \([(FM-DM)/(TM-DM)]*100\) |
| WHC | Water holding capcity | \((TM-DM)/LA\) |
3.1.2 Leaf anatomy
3.1.2.1 Stomata and trichomes density
Stomata and trichomes density are acquired via epidermis printing. First, apply double sided tape on your leaf and remove it. You now have a piece of tape with your trichomes on it. Place it on a glass-slide with the trichome-covered side on the top.
Then, to get your stomata, apply a thin coat of transparent nail polish and let it to dry. Then you remove it with double-sided tape and put it on a glass slide (nail polish on top).
Observations are made with the Olympus BX51 microscope.
And pictures are taken with the installed camera (currently Lumenera LW1135C-IO but about to change).
Pictures can then be uploaded in ImageJ and you can manually count stomata and trichomes using the multipoint tool.
There is a new opportunity to use LabelStoma, a deep leaning software for stomata detection.
It is developed by Ángela Casado-García and we are trying to make it work on some species that we study at EcoFog.
3.1.2.2 Anatomical structure
Leaf anatomical observations are made on razor blade hand-made cross sections of leaves.
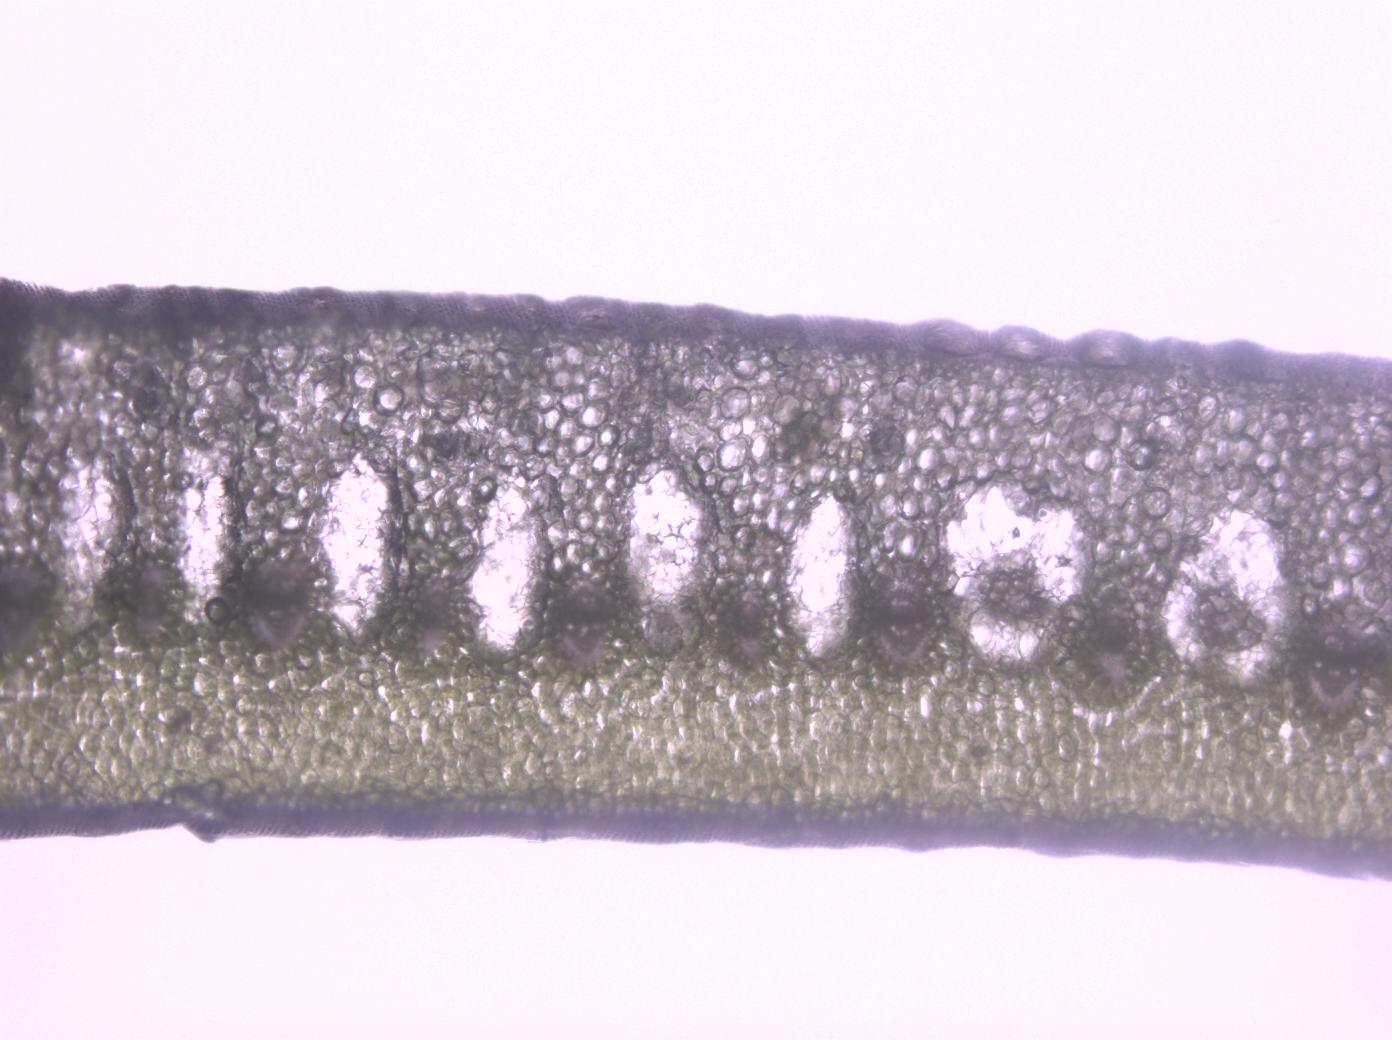
Figure 3.6: Hand made cross section of a bromeliad leaf
These cuts are directly placed in water/oil on a glass-slide and observed with the Olympus BX51 microscope.
And pictures are taken with the installed camera (currently Lumenera LW1135C-IO but about to change).
We recommend JPEG or TIFF.
On these pictures you can then make measurements such as width of the epidermis and cuticle.
The width of certain type of tissue (chlorenchyma, parenchyma, hydrenchyma) or the distance between vessels using ImageJ tools such as the draw segment and ctrl+M output (area, angle of the line and length).
Figure 3.7: Hand made cross section of a bromeliad leaf and possible anatomical measurements
3.2 Root traits
Root morphology analysis (length, diameter, etc.) are conducted using the Winrhizo software.
Winrhizo is a licenced software created by Regent Instrument Canada Inc. It exist 4 different version and we own the Basic Version. It allows root morphology analysis from scans.
3.2.1 Image Acquisition
3.2.1.1 Format
Supported image format are .TIFF, .JPEG and .BMP. .TIFFand .BMP are not compressed and are thus to be preferred. .TIFF images are compatible with all OS and should be privileged but you must be careful to save them uncompressed as WinRhizo won’t be able to open compressed ones.
The higher the resolution, the more pixel you will have and the more precise will be your measurements. However, with resolution, scan time and image size increase. 800DPI is the standard in this lab but 400 is the winrhizo recommendation. This depend on the required level of precision as well as the size of the analyzed roots ( the finer the higher must be the resolution to get more details).
3.2.1.2 Scanner
Any scanner can be used to acquire scans for Winrhizo software. However, be sure that the format is compatible and that all the images inside your project are saved in the same format and the same resolution. For coherence purposes we encourage you to use the same formats between studies at Ecofog’s lab scale. EPSON’s V800 scanners are the ones used as this document is being written. The scanner model isn’t important but we recommend to use scanners with a transparent (double-lamp) option. This will allow cleaner root scans for complex root systems. And the scanning software is VueScan
3.2.1.3 Scan process
3.2.1.3.1 Flat scan
You can decide to use basic scan options with light only coming from below. If you do so you need to have a white background installed under the scanner’s roof (if black roots, if pale ones you’ll need a black background).
Choosing this option will simplify your protocol and can suffice for simple and thin enough root systems.
EXEMPLE scan marion
3.2.1.3.2 Transparent
If your root are too big 3.8, then self-shading can appear on flat scan and bias winrhizo’s analysis. To avoid this shading you can remove the background from the scanner’s roof to enable double-lamp scanning. The light coming from top and bottom as one, shading will be avoid and scans will be cleaner.
Figure 3.8: Roots to thick to be flat scanned
Another case where you can prefer Transparent option is for complex root systems (e.g. bromeliaceae, 3.9) . For this type of roots, you can scan them in a thin coat of water to disentangle fine roots. Doing so you will have a better analysis of the root system morphology and structure but once again have shading issue. Supressing them requires the use of the Transparent mode.
Figure 3.9: Complex bromeliad adventitious root system
BEWARE: The Transparent scan window is smaller than the normal mode scan. The actual scanned zone is showed 3.10 and you must make sure that you roots are well placed within this area.
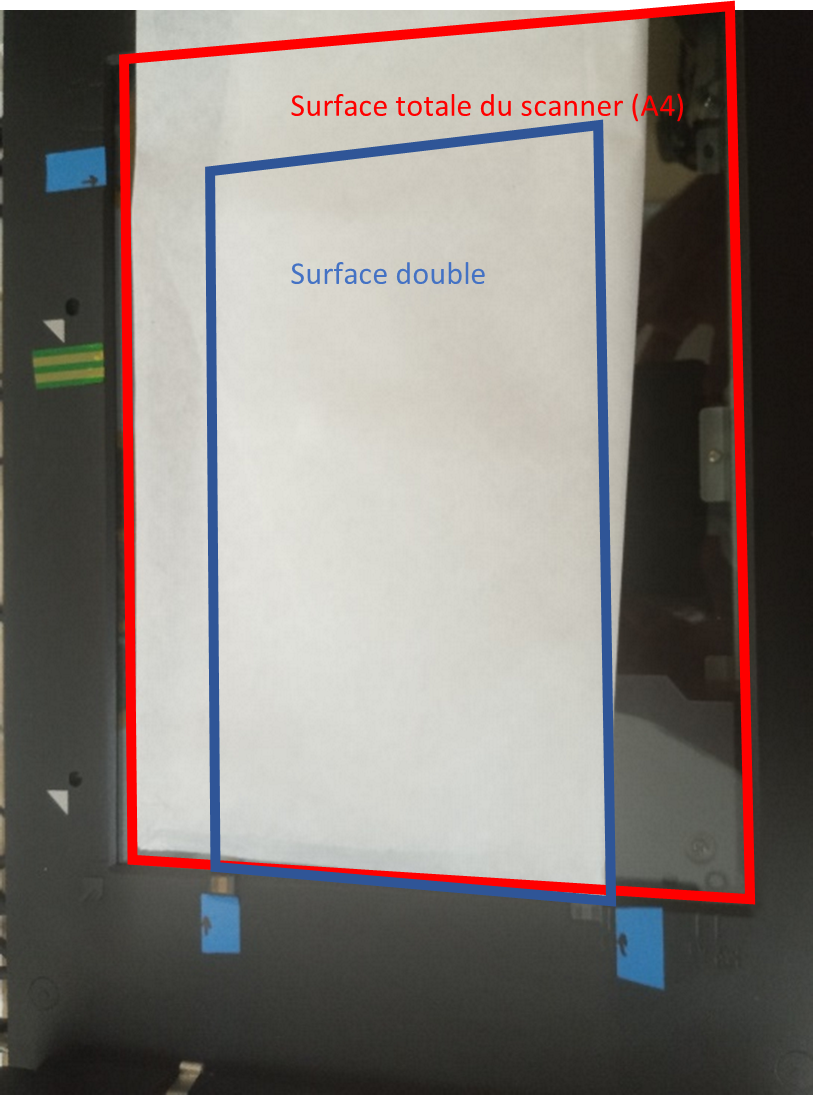
Figure 3.10: Flat (red) and Transparent (blue) scan zone of EPSON’s V800 scanner
3.2.2 Image processing
To analyze with winrhizo, you can either make it manually, one image at a time and by drawing rectangles around the roots you want to analyze.
However, when having a lot of scans you might want to automatize the process using the batch option.
If this is your choice, make sure that your images only contain roots!! Sometimes you will have to remove some parts of the scans to leave only roots in your images.
For instance, this 3.11 is the scan from bromeliads roots. We can see the water-filled petri dishes border on the scan and this will be an issue for automatized Winrhizo analysis.
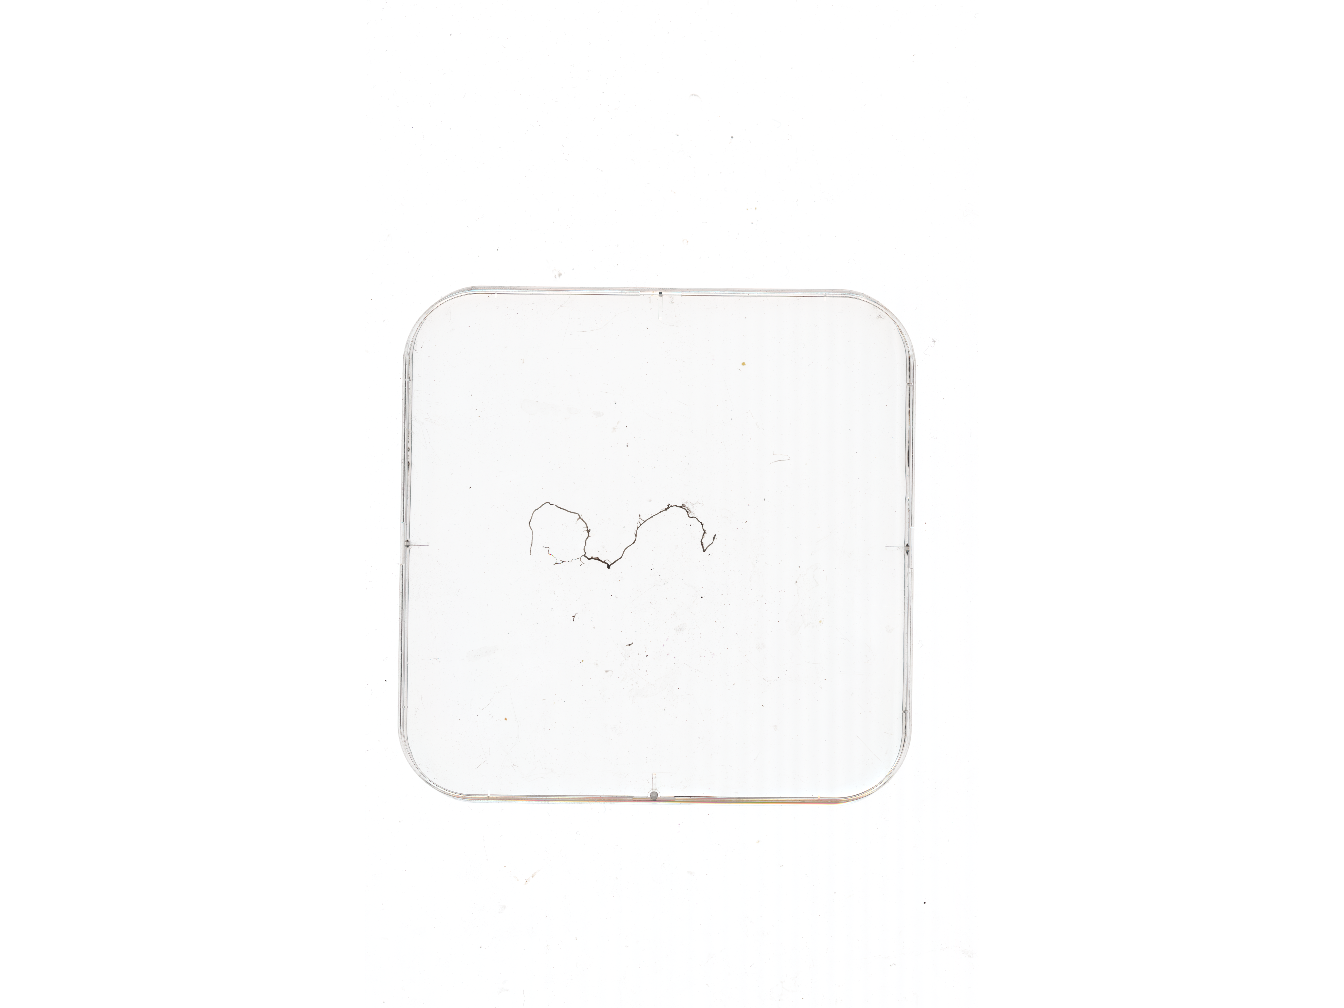
Figure 3.11: Scan of a bromeliad root system in water-filled petri dish
To re-crop these images we use the freeware XnConvert.
The petri dish has always been placed in the same place using a stencil ?? on the scan window, enabling us to recrop all scans to the same size.
Detailed XnConvert tutorial is available HERE.
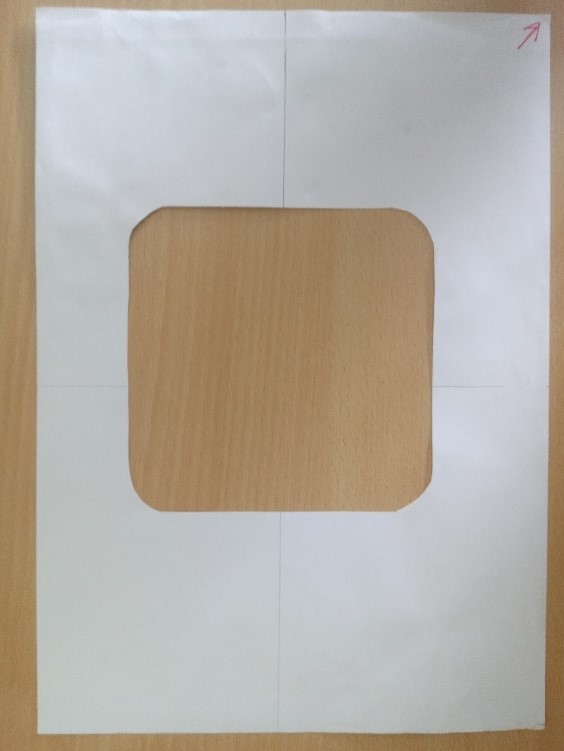
Figure 3.12: Stencil used for inwater root scans
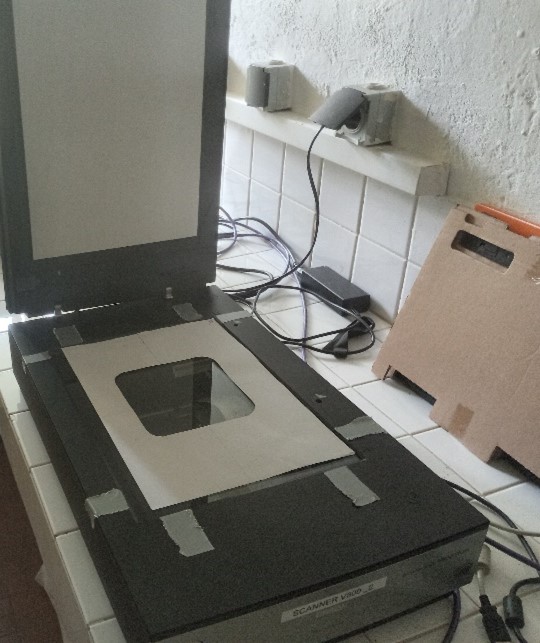
Figure 3.13: Stencil used for inwater root scans
3.2.3 WinRhizo
3.2.3.1 Installation
The winrhizo software is contained on a CD (ask Eliane Louisanna. To be used you need to copy the software from the disk to your computer and install the protection key drivers (also on the CD). Once installed you don’t need the CD to run the software but the protection key must be plugged. Unplugging it will prevent any use of the software.
3.2.3.3 First analysis
Once you have acquired your images and launched winrhizo you can start to analyze your scans.
To display a single scan, click Image -> Origin -> From File.
Then you can click the acquisition icon PIC.
This will open a standard document opening window.
Then you browse normally to find the wanted scan.
Make sure that you are looking for the goor format, by default, winrhizo display .TIFF.
When you open it, winrhizo display the targeted image and you can then click on it (analyze whole image) or make a selection (only selected region) to start an analysis.
When an image or region is analyzed, winrhizo display the sample identification window which allows you to enter information about the sample. These information will be saved with the measurements data. In this window click OK to do the analysis or Cancel to abort it.
After you clicked OK, winrhizo starts the analysis (can be stopped pressing S).
When done, winrhizo is ready to save the data but a file must be opened or created first.
Winrhizo display a window which asks wether to open one, create one or save nothing.
Selecting create one will create a new .TXT file to store analysis data (more info about output here).
Selecting open one will allow you to open a pre-existing file to add the new measurements at the end of this file.
Clicking on save nothing, guess?
In the image, you can now see which roots have been analyzed. This have a skeleton line over them. The absence of this skeleton indicates that these roots have not been analyzed. This can be due to non-optimal pixel classification (see more about it here).
WELL DONE! You just analyze your first picture!
You can practice with scans available here
3.2.3.4 Calibration
If not calibrated (associated with a scale), winrhizo will display results in pixels.
.TIFF files have an embedded scale, automatically detected by winrhizo.
Check on your results if they are in px (pixels), in (inches) or cm (centimeters).
However, you can sometimes have uncalibrated files (mistakes or images from camera).
Thus, you will need to “manually” calibrate your image.
Winrhizo calibration files are saved as .CAL. In the Calibration menu you can load pre-existing calibration files.
You will find the calib_imge.TIFF here.
To make your calibration at any DPI, you can print this image and scan it at the wanted DPI.
The black square in the image delimit a white 1x1cm square.
Loading this image in winrhizo, you can click on calibration -> pixel size method -> object of known dimension -> 1 image -> width=1 , height=1, border=0.35, units=cm -> Ok
Then, winrhizo will propose you to save the calibration in a .CAL file that can be loaded later and used for all your images at a given resolution. .
Please, when you create a .CAL at a previously not used resolution, store a copy of the calibration file here so that your work helps your successors!!
3.2.3.5 Batch
We saw how to analyze a single picture or region but you might have numerous scans to analyze and want to automatize this process. To do so you will give winrhizo a batch (i.e. a folder) containing any number of images you want.
3.2.3.6 Pixel classification
Pixel classification is how winrhizo discriminate between actual “root” pixels and scan background. To do this distinction you have several options presented in Analysis -> Root & Background Distinction menu. This distinction is made grey levels and can either be set to automatic or manual. Automatic option either sets a global threshold (default) of grey value at which the pixel is attributed to roots or background or it can be used with lagarde options which consider local region (region size can be defined in pixels) of the picture and associate different threshold values. We don’t recommend the use of lagarde option but a careful cleaning of your roots and high quality scans. However you can test different options with some of your scans to chose the best options. It is also important to tell the software if your scans are Dark roots on White background or the contrary.